|
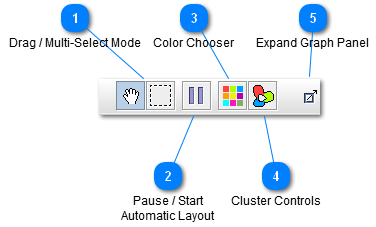
 Drag / Multi-Select Mode
The drag mode and multiple selection mode buttons change the behavior of clicking on nodes and the graph background as described in the Graph Interaction section.
| |
 Pause / Start
Automatic Layout
The pause and start (play) toggle button allows stopping and starting the Graph Layout algorithm so individual nodes can be moved without dragging the rest of the graph with them. | |
 Color Chooser
| |
 Cluster Controls
| |
 Expand Graph Panel
Allows the Graph Panel to be expanded to the full screen, hiding the tables. you can also accomplish this by clicking the arrow icons at the top of the vertical divider between the Tables and the Graph.
| |
|
|