|
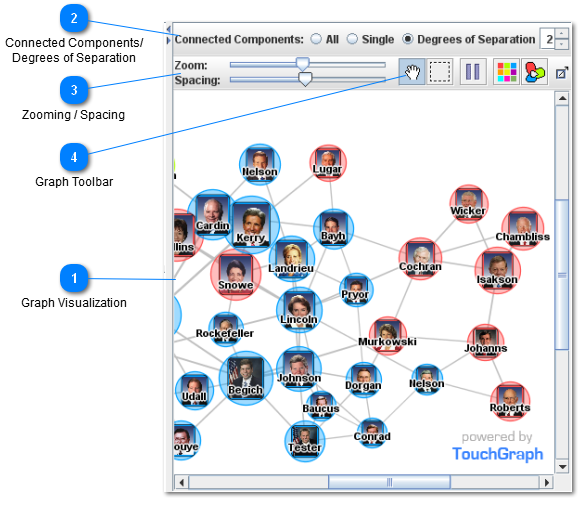
 Graph Visualization
| |
 Connected Components/
Degrees of Separation
| |
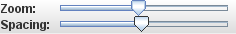
 Zooming / Spacing
The Zoom and Spacing sliders provide two different ways to enlarge the graph image.
| |
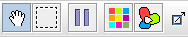
 Graph Toolbar
The Graph Toolbar provides shortcuts to tools for configuring the visualization.
| |
|
|