TouchGraph Navigator 2, Welcome!
Licensing and Support
Samples Licensing
Installation
System Requirements
Navigator Web Installation
Applet Launcher Page
TouchGraph Navigator Overview
Menus
File Menu
Export Data dialog
Export Image dialog
Add Search Entity dialog
Settings Menu
Edit Menu
View Menu
Tools Menu
Help Menu
Definitions
Navigator 2: New Features
Loading Wizard
Select Input
Excel
CSV / TSV
MCSV
Navigator DB API
NavigatorDbApi Script
MySQL
Data Types & Delimiters
Entities & Relations
Choose A Table
Edit Entity
Edit Relation
Dynamic Relations
Co-occurrences
Dynamic Attributes
Aliases
Settings
Names - Types / Attributes
Names - Entity Labels
Filter - Inclusion
Filter - Attribute Filters
Add Filter Dialog
Node - Colors
Node - Label / Image
Node - Halo Size / Shape
Node - Node Tags
Edge - Colors
Edge - Width / Pattern
Edge - Tags / Arrows
Graph Layout
Graph Panel
Nodes, Edges
Graph Interaction
Connected Components
Zooming, Spacing
Graph Toolbar
Color Chooser Dialog
Cluster Dialog and Algorithm
< Previous page Next page >

Zooming, Spacing

Zooming, Spacing
 
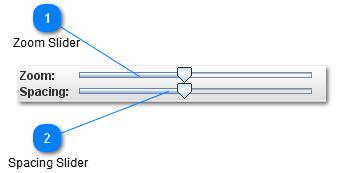
The Zoom and Spacing sliders provide two different ways to enlarge the graph image.
 
1

Zoom Slider


The Zoom slider will proportionately enlarge the nodes and edges.  As you zoom, the text size will get larger or smaller, and the thickness of the edges and other lines will increase or decrease.
[Top]
2

Spacing Slider


The Spacing slider increases spacing between nodes without enlarging the nodes or making the edges thicker. This is useful for seeing connections within tightly connected clusters.
[Top]