TouchGraph Navigator Overview
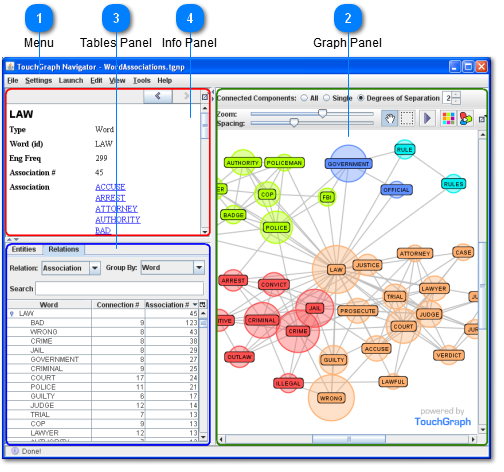
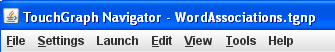
 Menu
|
|
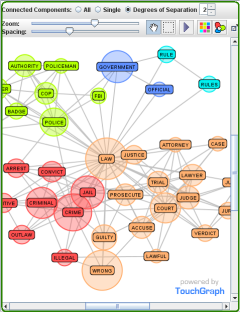
 Graph Panel
The Graph Panel shows the visualization of the graph data. You can interact with it by clicking on nodes and using toolbar options such as zooming and color controls. Fine grained control over what is displayed is possible via the Settings Dialog.
|
|
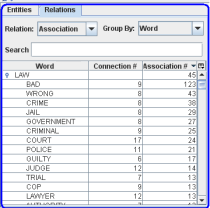
 Tables Panel
The Tables Panel shows loaded data in table form. You can see a list of entities and relations as well as their attribute values.
|
|
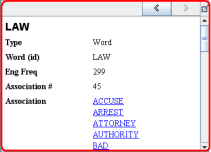
 Info Panel
The Info Panel provides an in-depth look at a single entity or relation. You can see the complete list of attributes with their values, as well as a list of related entities.
|
|